Tag Archives: slope
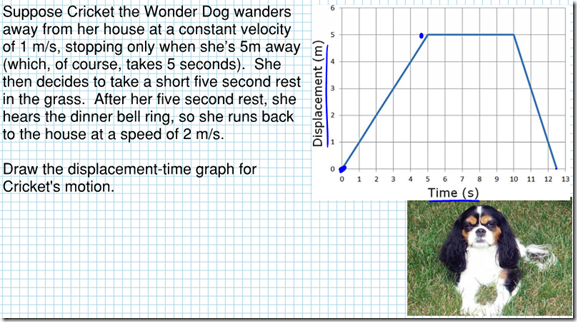
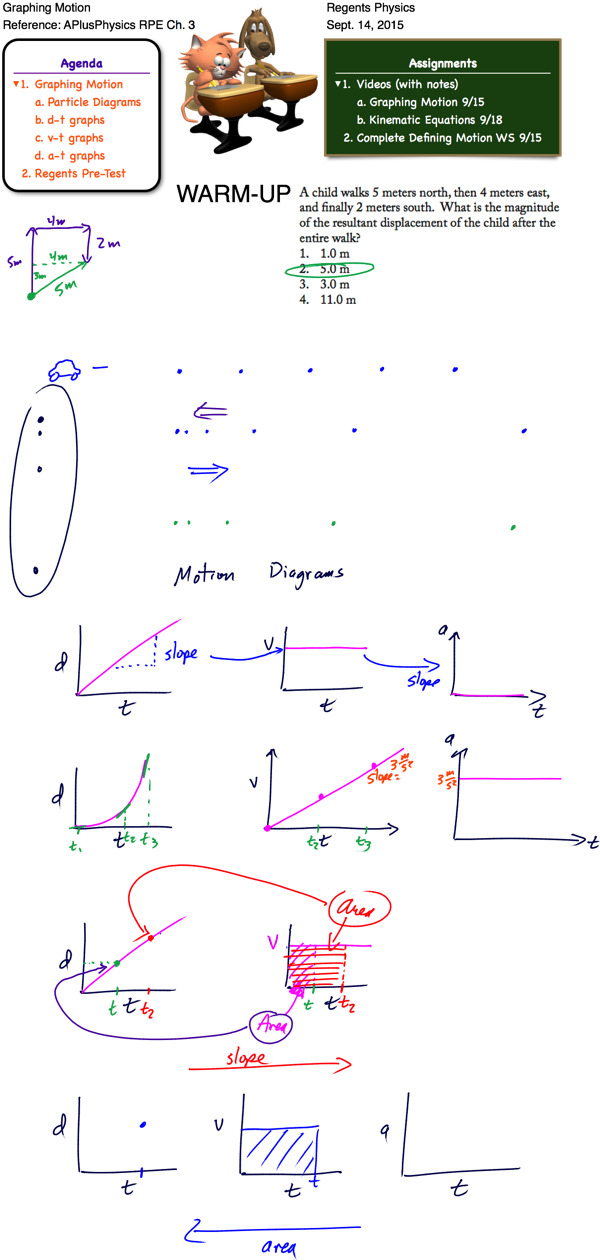
Intro to Graphing Motion
Bouncy Ball Lab


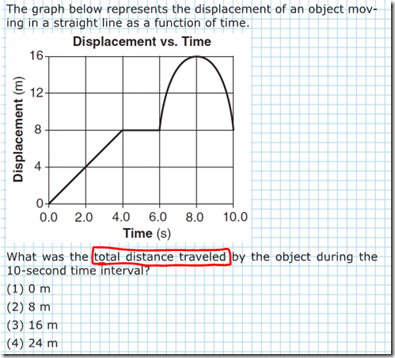
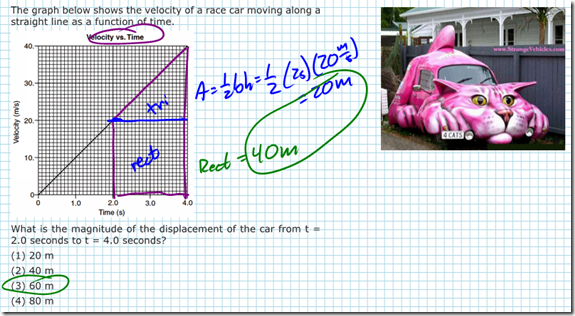
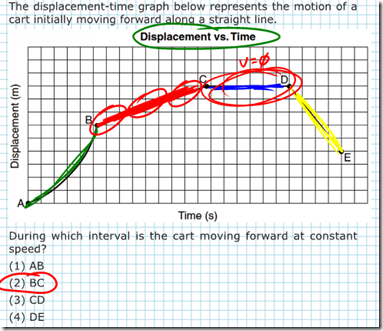
Motion Graphs
Agenda:
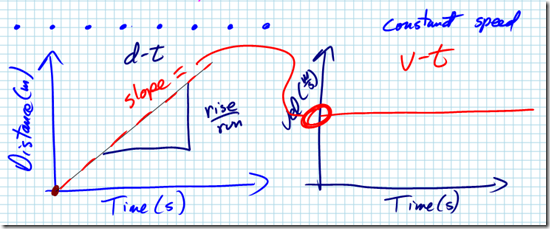
d-t and v-t graphs
http://www.theuniverseandmore.com
Homework:
1) Complete reading pp. 30-42, Qs 9-11, 13-17 today
Then students worked through World 1 of http://www.theuniverseandmore.com
Constant Velocity Particle Model
Regents Vector Quiz 0003 Solutions
Hooke’s Law Lab
Hooke’s Law
An interesting application of work combined with the Force and Displacement graph is examining the force applied by a spring. The more you stretch a spring, the greater the force of the spring… similarly, the more you compress a spring, the greater the force. This can be modeled as a linear relationship, where the force applied by the spring is equal to some constant time the displacement of the spring. Written mathematically:
![]()
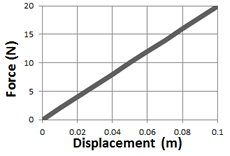
F is the force of the spring in newtons, x is the displacement of the spring from its equilibrium (or rest) position, in meters, and k is the spring constant which tells you how stiff or powerful a spring is, in Newtons per meter. The larger the spring constant, k, the more force the spring applies per amount of displacement.
You can determine the spring constant of a spring by making a graph of the force from a spring on the y-axis, and placing the displacement of the spring from its equilibrium, or rest position, on the x-axis. The slope of the graph will give you the spring constant. For the case of the spring depicted in the graph at right, we can find the spring constant as follows:
![]()
You must have done work to compress or stretch the spring, since you applied a force and caused a displacement. How can you find the work done in stretching or compressing the spring? By taking the area under the graph. For the spring shown, to displace the spring 0.1m, we can find the work done as shown:
![]()


