
About This File
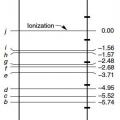
Using an energy-level diagram of mercury, students determine the energy released (in eV) for specific electron transitions, as well as the wavelength of the emitted photon (in nm).
Students then use this data to draw/color both emission and absorption spectra.